


What is a self-assembling hydrogel?
Place specific peptides in water, adjust the pH, and they gel. No cross-linker, no UV, nothing external- just the molecules determining that being ordered requires less energy than being dissolved. This is the brief explanation of self-assembly, and it’s not a trick. It’s thermodynamics. The very same hydrogen bonds, hydrophobic interactions, and electrostatic pairing that fold proteins and construct cell membranes operate here too, simply applied to molecules a researcher has engineered.
The fibers that develop are 5 to 20 nanometers wide – akin to natural collagen. The gel retains water, deforms under stress, and rebounds when the stress is removed. None of that is unexpected. What is less apparent is that, because the bonds fastening the network are reversible, the gel can react to its surroundings in ways a permanently bonded material cannot. Reduce the pH, and it dissolves. Introduce the correct enzyme, and the cross-links are cleaved. Force it through a syringe needle, and it flows; leave it undisturbed for a few seconds, and it solidifies again. That final characteristic, shear-thinning and recovery, is precisely why injectable hydrogels have become highly valuable for delivering medications and cells to particular sites without surgery.
The ECM comparison is frequently employed in this domain, occasionally too broadly. However, the structural similarity is genuine: fiber width, pore size, water content, and mechanical pliability. Whether a synthetic gel truly functions like ECM biologically is another matter, and the candid response is generally ‘partially, contingent on your particular concerns.
Where these materials show up in practice
Drug delivery
A gel injected into a tumor stays put and dispenses medication over days. Strengths that would be poisonous systemically are acceptable locally. This is not complex in idea — the difficulty has always been enabling the gel to break down at the proper speed, disperse at the proper speed, and not instigate a fibrotic reaction. Stimuli-sensitive versions, where the gel only begins dispensing when it senses the tumor’s acidic pH or increased protease action, are further advanced than they were five years ago and starting to produce valuable preclinical findings.
Cell scaffolds and tissue models
Cells on flat plastic act differently than cells in tissue. Gene expression, morphology, and response to drugs: all of it changes when you go from 2D to 3D and from plastic to a soft fibrous matrix. Self-assembling hydrogels have been used for neural, cardiac, hepatic, and tumour models where the 2D readout is known to be misleading. They are not a perfect substitute for native tissue, but they are better than nothing, and the gap has been closing as people get better at tuning stiffness and surface chemistry independently.
Injectable regenerative scaffolds
The outcome that garnered the most notice in recent times is the IKVAV peptide amphiphile hydrogel from the Stupp team at Northwestern, a gel displaying a nerve-growth-encouraging sequence from laminin, administered into spinal cord injury locations. Mouse findings from 2021 indicated paralyzed subjects regaining hindlimb capability. Phase I clinical data ensued in 2024, with certain individuals with total thoracic injuries demonstrating motor advancements. That does not occur naturally in this state. The investigation is ongoing, the participant group is modest, and no one is making exaggerated assertions, but it shifted the discussion from scholarly interest to something medical professionals are observing.
Measuring what you made
Rheology first
Before anything else, run oscillatory rheology. G-prime tells you how stiff the gel is. G-double-prime tells you how viscous. The crossover where G-prime exceeds G-double-prime is the gel point. The storage modulus in the linear viscoelastic region is the number you report and compare. Neural tissue is around 100 to 500 Pa. Cartilage is 10 to 100 kPa. If you are making a scaffold for neurons and your gel is 50 kPa, the cells will notice before you do.
What rheology misses
Rheology provides a single metric for gels – their firmness. It doesn’t reveal the network’s arrangement, whether pores are interconnected or isolated, or the reason two gels with identical G-prime exhibit varied drug release patterns. For such insights, microstructure examination is necessary, and this analysis must be quantitative for effective comparison across different scenarios or production runs.
Scientists at KPI created a process that transforms brightfield microscopy visuals of hydrogel specimens into connectivity diagrams. Sobel edge detection pinpoints intensity shifts at gel borders; K-means clustering (k=2) separates the matrix from space; morphological refinement eliminates extraneous data; repeated binary expansion (20 cycles, 9×9 element) detects which gel regions are proximate enough to be linked. Each segment transforms into a point; encroaching expanded areas form connections.
Graph-based structural analysis of hydrogel networks
The KPI pipeline produces graphs from brightfield microscopy images without requiring fluorescent labelling or special sample preparation. Across a dataset of hydrogel images, max clique size was stable (mean 11.8, SD 1.31), node degree was consistently high (mean 13.54), and the terminal-to-non-terminal ratio in the minimum spanning tree was 2.81 on average. The authors note that absolute values depend on hyperparameters, but that relative comparisons between gel classes are robust — making the approach useful for batch QC and for comparing structurally different formulations.
The three-step segmentation process is shown below: original brightfield image, binary clustering mask, and the identified matrix regions overlaid on the original.
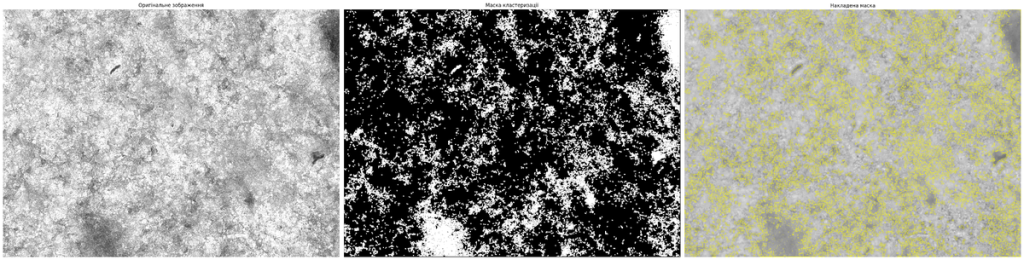
Figure 1. Segmentation: original brightfield image (left), K-means clustering mask (centre), overlay showing identified gel regions in yellow (right).
Once segmented, connected components are labelled, and a connection network is built. The full pipeline from raw image to connectivity graph takes the original image through colour-coded component labelling to a red connection network showing which regions communicate.
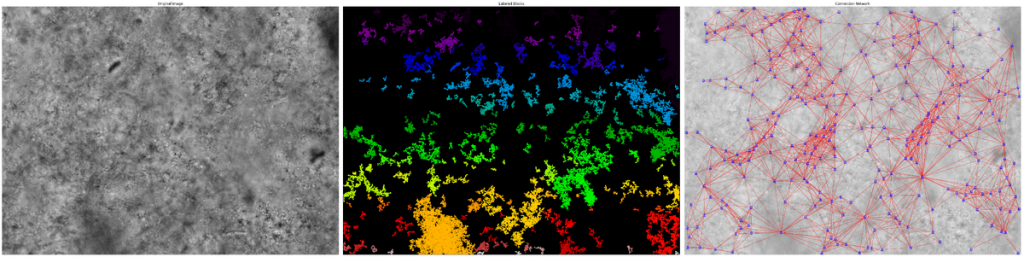
Figure 2. Full pipeline: original image, labelled connected components, and connection network overlaid on the original.
The graph can be rendered directly on the microscopy image, with node size scaled to connection count. Dense hub regions are immediately visible as large nodes — these are the most connected parts of the matrix.
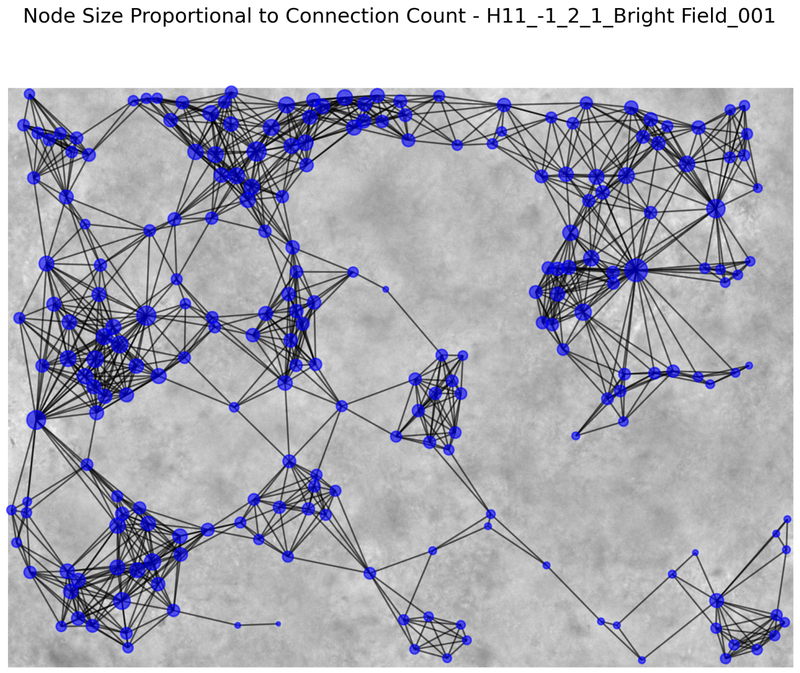
Figure 3. Graph overlaid on brightfield image. Node size reflects connection count
Reading the numbers
Max clique size: the largest fully connected subgraph. Mean 11.8, SD 1.31 across the dataset. The tight spread means this parameter is stable across images — it is picking up a real structural property, not noise. Consistent clique size across batches is an indicator of gel reproducibility.
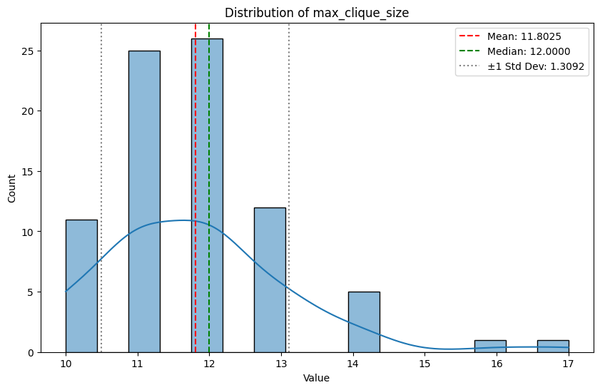
Figure 4. Distribution of max clique size (mean 11.8, median 12.0, SD 1.31)
Terminal-to-non-terminal node ratio: mean 2.81, median 2.04. In a typical gel from this dataset, there are roughly 2 dead-end branch nodes for every core connection node. A high ratio means tortuous pores and slow diffusion. A low ratio means a more open network and faster diffusion. This connects directly to release kinetics without needing a separate diffusion experiment.
The average path length heatmap makes spatial heterogeneity visible. Some regions of the same gel have much longer average diffusion paths than others, which matters if you are trying to get uniform drug distribution or uniform nutrient access for encapsulated cells.
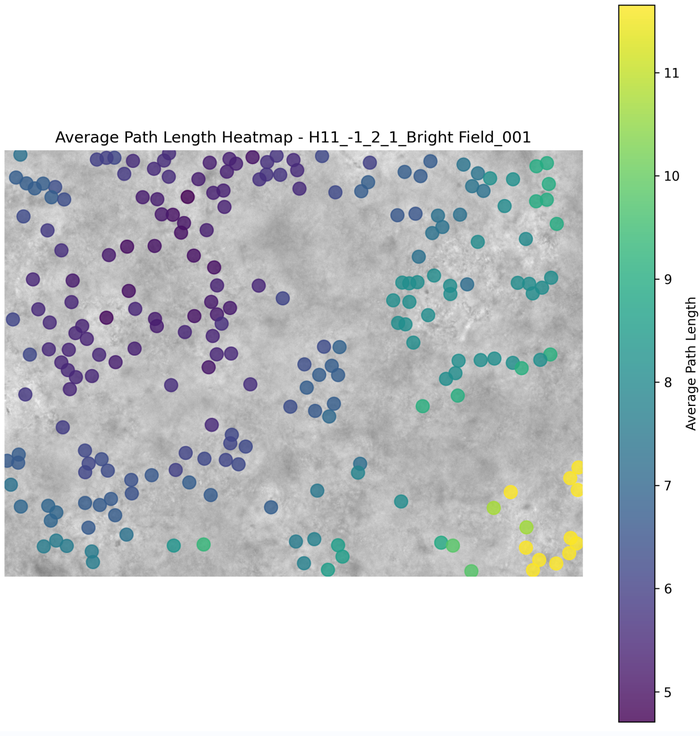
Figure 5. Average path length heatmap. Yellow = longer paths, higher tortuosity. Purple = shorter paths, more accessible
Why tissue-derived ECM matters alongside synthetic gels
Every synthetic hydrogel in this field is, at some level, an approximation of ECM. The question is always: close enough for what? For mechanistic studies where you need to isolate one variable — stiffness, or the presence of one specific peptide sequence — synthetic gels are the right tool because you control what goes in. But when you need to know how cells actually behave in something resembling their native environment, the approximation stops being good enough.
Decellularised ECM from human tissue retains what years of biological assembly produced: the right collagens in the right proportions, the proteoglycans, the sequestered growth factors, the nanoscale architecture. You cannot reconstitute this from components. Hepatocytes in liver-derived ECM maintain cytochrome P450 enzyme activity that degrades within days on collagen or Matrigel – this is not a small difference for anyone running drug metabolism assays. Tumour-derived ECM has the elevated stiffness and fibronectin content of actual tumour stroma, which changes drug response in ways relevant to oncology research. Tissue specificity is not decorative.
For researchers developing synthetic scaffolds, comparing your gel against tissue-matched ECM is the most honest benchmark available. For researchers who need physiologically relevant results without spending months optimising a synthetic formulation, ECM hydrogels are the direct route.
Frequently asked questions
Q1. What truly powers self-assembly — is it solely hydrogen bonding? Hydrogen bonding is significant, but it’s not the sole force, and often not the primary one. In water-based systems, the hydrophobic effect frequently propels assembly more powerfully — concealing nonpolar fragments liberates ordered water molecules, which is entropically advantageous. Electrostatic forces between oppositely charged fragments stabilize assembled forms in charge-complementary peptides. Pi-pi stacking between aromatic side chains (Phe, Tyr, Trp) reduces the critical gelation threshold considerably and is why Fmoc-modified dipeptides gel at such low amounts. In application, most self-assembling gel systems utilize several of these concurrently.
Q2. How does the terminal-to-non-terminal ratio connect to drug release? Terminal nodes in the minimum spanning tree are dead ends — pores with one opening rather than multiple connections. A high ratio means more of the pore space is in these dead-end branches, which increases the tortuosity of the diffusion path. Slower diffusion, more sustained release. A low ratio means a more open, well-connected network where molecules move faster. The connection is not perfectly quantitative without running a diffusion experiment, but it gives you a structural explanation for the release profile you observe — and it can flag problems before you run cells in the gel.
Q3. When is tissue-derived ECM clearly the better choice over a synthetic scaffold? When the biological response you are studying depends on cues that no defined synthetic material currently provides. Drug metabolism in hepatocytes is the clearest example — liver-specific ECM cues maintain CYP enzyme activity that generic scaffolds do not. Tumour microenvironment modelling is another — the stiffness, matrix composition, and growth factor milieu of tumour-derived ECM produce drug response profiles that synthetic gels do not replicate. Any time you need your in vitro model to predict what happens in human tissue, tissue-matched ECM is the more defensible choice.
Q4. Can the KPI graph analysis pipeline handle ECM hydrogel images? It should work on any grayscale microscopy image where gel matrix produces sufficient contrast against background — brightfield, phase contrast, and fluorescence all qualify. ECM gels tend to be more heterogeneous than single-component synthetic gels, so the parameter distributions will be wider and you will need more images to get stable statistics. The authors recommend fixing your hyperparameter set and applying it consistently across everything you want to compare.
Q5. What is the minimum characterisation before I run cells in a hydrogel? Gelation confirmed by tube inversion. G-prime from oscillatory rheology — at minimum a frequency sweep in the linear viscoelastic region, reported at a defined frequency. Stability at 37 degrees over your experimental timeframe. If you are doing drug delivery, a release curve in the relevant buffer before adding cells. The KPI structural analysis is not strictly minimum, but if your release data looks unexpected, checking network topology is a faster diagnosis than re-running the release experiment with different formulations.
References
Webber et al., Nature Materials (2016) · Li & Mooney, Nature Reviews Materials (2016) · Hartgerink et al., Science (2001) · Stupp group, Northwestern Medicine (2024) · Badylak SF, Acta Biomater (2015)
Written by Oleg Komarnitsky